


1) State of Agentic AI 2) Acquiring Pricing Models 3) Can Revolut scale to $150bn? 4) What does it take to win in FinTech?
Welcome to my newsletter! Each week a few hand-picked topics from the world of fintech, payments and banking with behind-the-scenes analysis!

1) State of Agentic AI

If you want to understand how Agentic AI is transforming everything, this is a must-read.
Here are my key takeaways from ISG’s latest State of the Agentic AI Market Report:
1. Most agentic AI use cases pick up where GenAI leaves off - while GenAI excels at extracting and summarizing information, it stops short of taking action. Agentic AI builds on that foundation, using the information to autonomously execute tasks with minimal human intervention.
2. Among more general, non-industry-specific applications of agentic AI, over half are found in IT, while marketing, sales and finance each account for only about 10%.
3. 70% of agentic AI use cases are concentrated in just three industries: 1) banking, financial services, and insurance 2) retail 3) manufacturing.
4. Simple and model-based agents currently dominate the market, accounting for 43% of use cases due to their effectiveness in task-focused automation. As enterprise needs grow more complex, goal-based agents will gain traction - but providers must ensure the right agent is matched to the right problem.
5. Providers are delivering quick, pre-built agentic AI solutions to drive immediate value, especially for enterprises still grappling with GenAI adoption. At the same time, they’re investing in more advanced multi-agent systems, anticipating that orchestration will become the key challenge as adoption matures.
6. Only 25% of agentic AI solutions operate independently; most still rely on human oversight or advisory roles. As full autonomy remains limited, providers are prioritizing orchestration and governance to help enterprises balance control and prepare for broader adoption.
7. Data quality and organizational readiness are the biggest hurdles to agentic AI adoption. Even mature AI enterprises struggle with outdated data frameworks, while others face skill gaps and unclear business cases.
8. Data is critical to realizing ROI from agentic AI. Providers are using agents to tackle complex data issues - like monitoring, enrichment, and governance - but traditional data architectures aren’t sufficient. To scale agentic AI effectively, enterprises must rethink how their data is structured and accessed.
9. Enterprise adoption of agentic AI starts with efficiency gains but is quickly evolving toward broader goals like revenue growth and business model reinvention. While early use focuses on automating complex back-office tasks, organizations are moving up the value chain toward front-office and industry-specific applications that drive long-term strategic impact.
Link to the ISG report: https://isg-one.com/advisory/ai-advisory/state-of-the-agentic-ai-market-report-2025
2) Acquiring Pricing Models
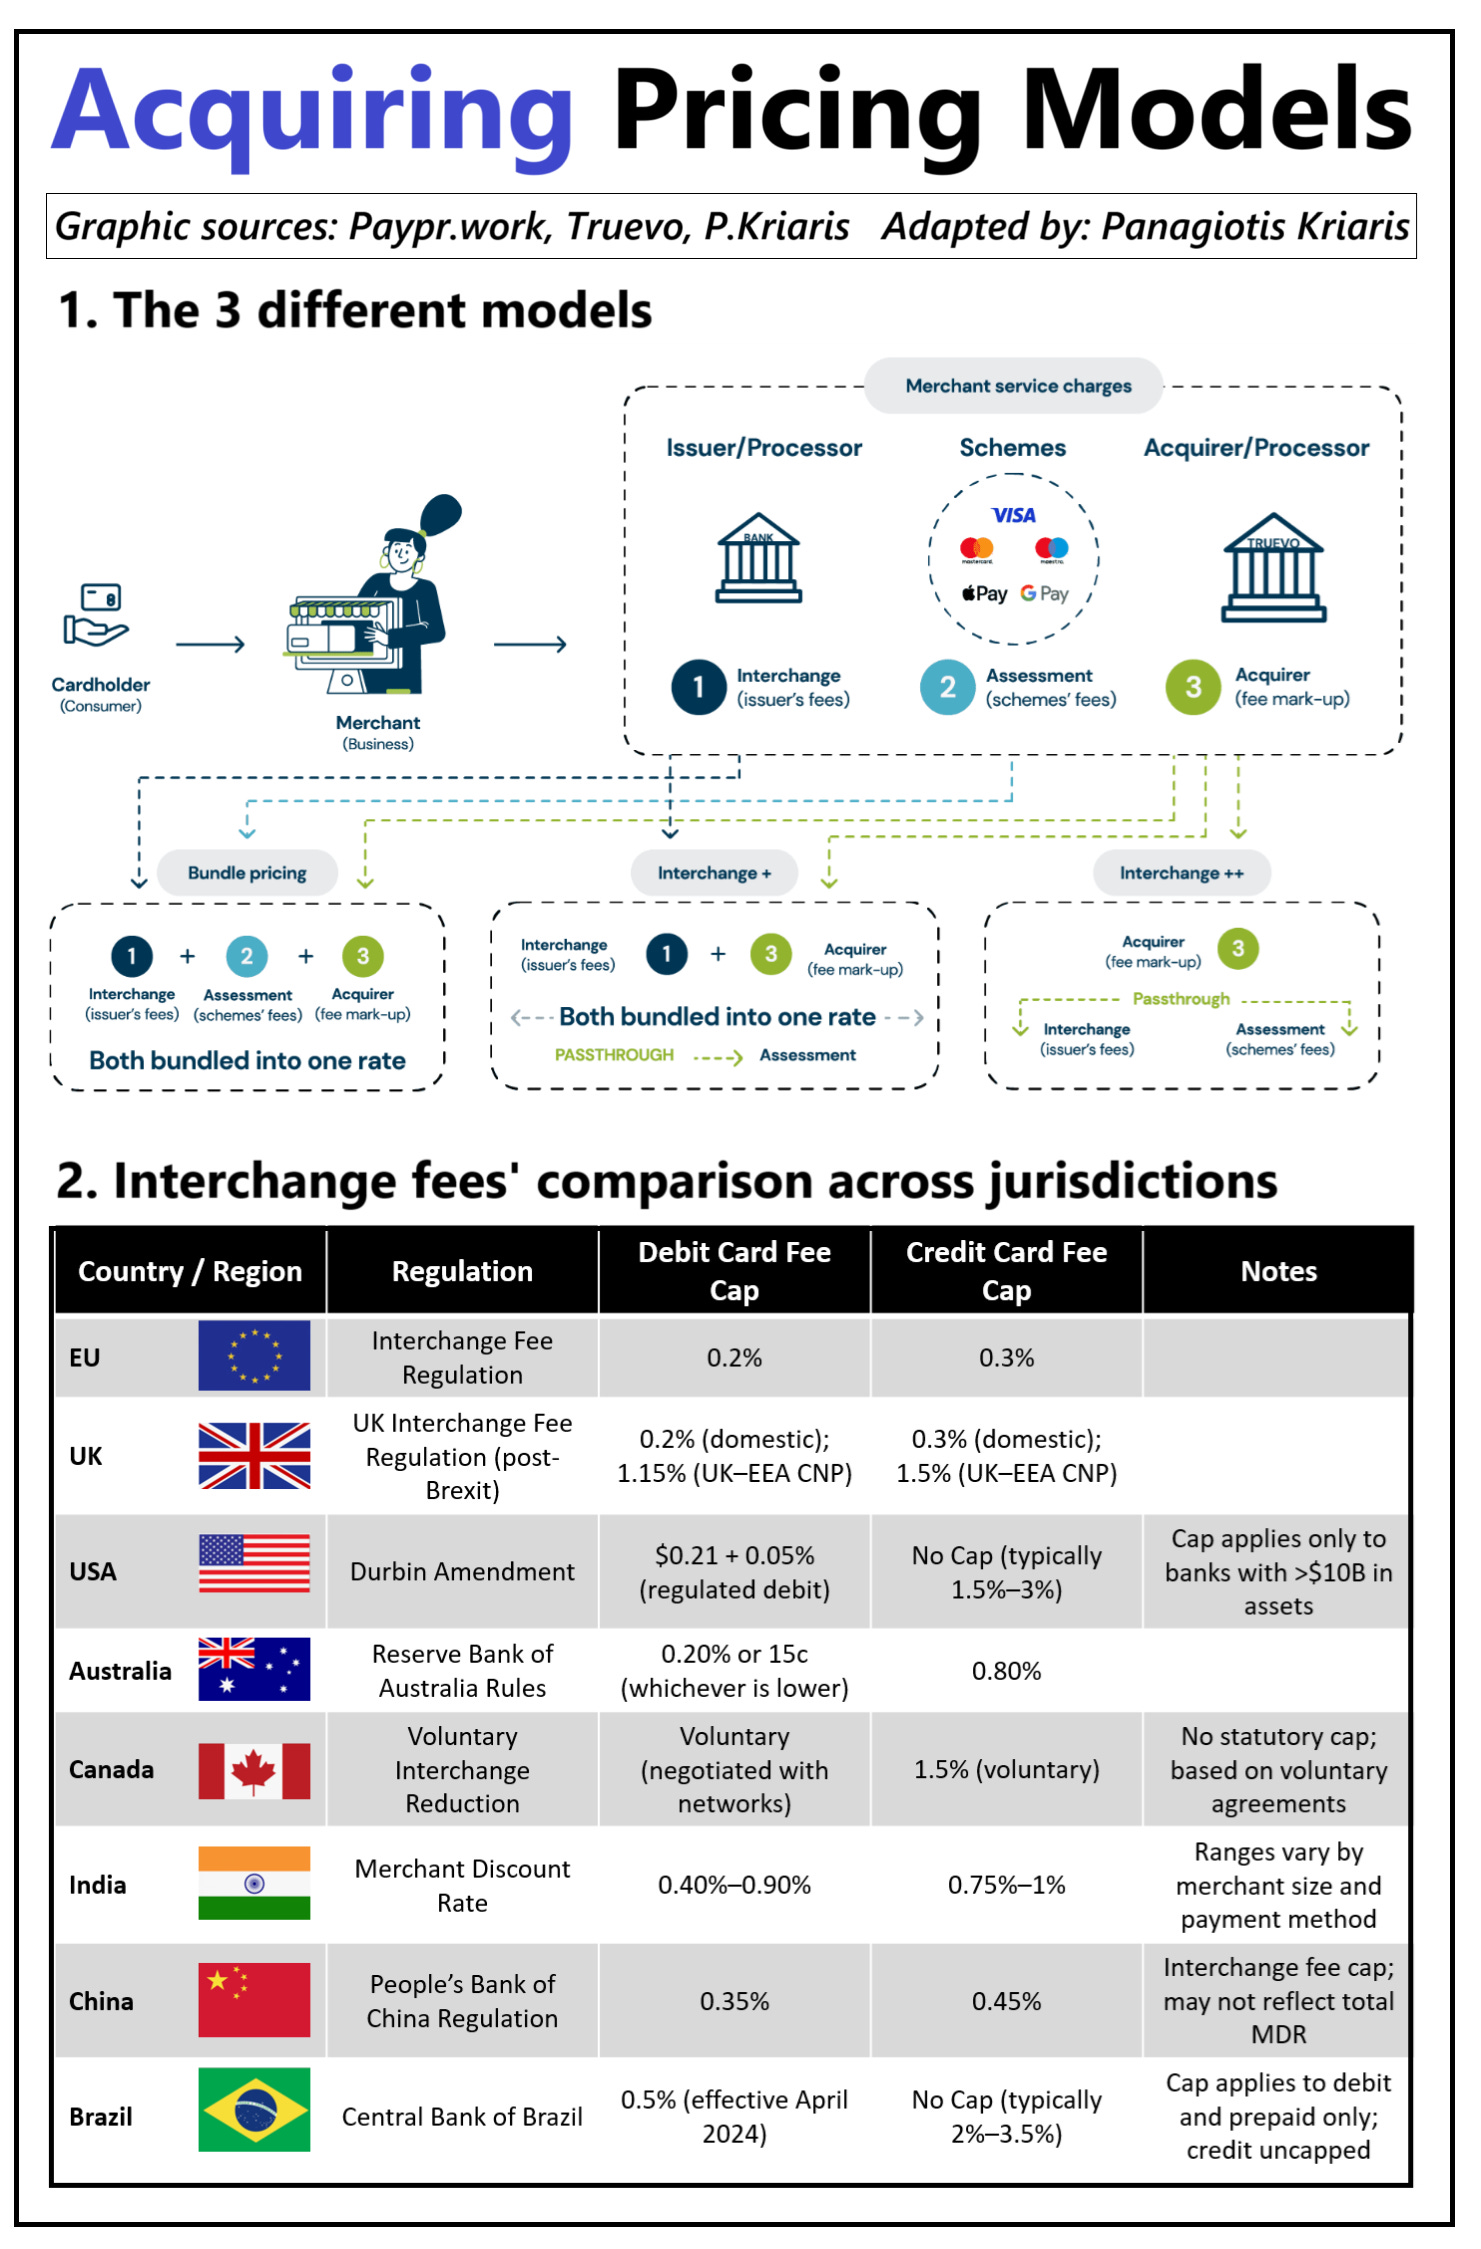
Every card payment involves three core fees - yet most merchants don’t know where their money goes. Here is a break-down.
𝗧𝗵𝗲 𝟯 𝗳𝗲𝗲 𝘁𝘆𝗽𝗲𝘀:
1. Interchange – Paid from the acquirer to the issuer (the cardholder’s bank). Set by card networks, often regulated, and meant to cover fraud, credit risk, and infrastructure.
2. Scheme Fee – Charged by the card networks (Visa, Mastercard, etc.) for operating the rails.
3. Acquirer Markup – What the acquiring bank or PSP charges the merchant to process the transaction, handle risk, and settle funds.
Together, these form the Merchant Service Charge.
𝗧𝗵𝗲 𝟯 𝗽𝗿𝗶𝗰𝗶𝗻𝗴 𝗺𝗼𝗱𝗲𝗹𝘀:
1. Bundled: All three fees are merged into one opaque rate. Common among smaller merchants. Simple, but lacks visibility.
2. Interchange+: Interchange and acquirer fee shown; scheme fee included in the markup. Partial transparency.
3. Interchange++: All three fees itemized. Full transparency. Preferred by larger or multi-market merchants.
𝗪𝗵𝗼 𝗱𝗲𝗰𝗶𝗱𝗲𝘀 𝘁𝗵𝗲 𝗺𝗼𝗱𝗲𝗹?
- The acquirer or PSP typically offers the pricing model, and unless a merchant has the volume or experience to negotiate, they’re often placed on bundled pricing by default.
- Larger merchants or platforms - who understand the mechanics and can estimate true costs - usually push for Interchange++ for its transparency and fairness.
- Smaller businesses rarely ask, either because they don’t know the models exist, can’t easily compare offers, or assume it’s not worth the effort.
𝗜𝗻𝘁𝗲𝗿𝗰𝗵𝗮𝗻𝗴𝗲 𝗳𝗲𝗲𝘀' 𝗰𝗼𝗺𝗽𝗮𝗿𝗶𝘀𝗼𝗻:
Some jurisdictions cap interchange fees (EU, UK, China, Brazil) to reduce merchant costs and promote competition. Others (US) regulate only parts of the system - e.g., debit under Durbin for large banks - while leaving credit cards uncapped.
Why?
It’s a mix of politics, lobbying, market structure, and regulatory philosophy:
- In Europe, regulators treat interchange as as insufficiently competitive and have imposed caps to bring more balance and transparency.
- In the US, the market relies more on competition, resulting in higher fees.
- Emerging markets like India and Brazil regulate interchange as part of broader financial inclusion efforts.
- In regulated markets, lower and more predictable fees help merchants manage costs and often support broader payment acceptance. In unregulated markets, higher interchange allows issuers to fund consumer perks like cashback and rewards — but merchants may face higher costs, which can influence pricing or acceptance choices.
Each model shifts value differently across the ecosystem, affecting how costs and benefits are distributed between banks, merchants, and consumers.
What's your experience?
Opinions: Panagiotis Kriaris, Graphic sources: Paypr.work, Truevo, Panagiotis Kriaris
3) Can Revolut scale to $150bn?

Can Revolut scale from a $45bn to a $150bn valuation? That’s 2.6x Deutsche Bank’s market cap - despite DB holding 10x more loans and 20x more deposits.
𝗥𝗲𝘃𝗼𝗹𝘂𝘁’𝘀 𝗕𝘂𝘀𝗶𝗻𝗲𝘀𝘀 𝗠𝗼𝗱𝗲𝗹:
- Multiple revenue engines: Cards, payments, FX, subscriptions, crypto trading and interest income.
- Efficiency at scale: High profit margins that strengthen as transaction volume grows.
- Expansive product suite: From IBAN-enabled accounts and RevPoints loyalty to mortgages-in-testing, BNPL, personal loans, credit cards and crypto.
- Referral-driven growth: 65% of new customers via peer recommendations.
- Profitable global rollout: Sustained profitability alongside market launches.
𝗪𝗵𝗮𝘁 𝗻𝗲𝗲𝗱𝘀 𝘁𝗼 𝗵𝗮𝗽𝗽𝗲𝗻 𝘁𝗼 𝗴𝗲𝘁 𝘁𝗼 $𝟭𝟱𝟬𝗯𝗻:
- Grow the user base north of 100 million and shift Revolut from a secondary wallet to customers’ primary banking relationship.
- Drive deeper usage of high-margin services—particularly mortgages, business lending and wealth products—to lift revenue per user.
- Advance fraud-prevention capabilities and partnerships to stay ahead of APP scams as scale increases.
- Secure additional banking licences worldwide, unlocking deposit-taking, lending capacity and institutional trust.
- Build end-to-end risk, AML and compliance infrastructure that can support rapid global expansion.
- Keep the innovation engine running - iterating new features and products (with careful controls around volatile sectors like crypto).
𝗖𝗵𝗮𝗹𝗹𝗲𝗻𝗴𝗲𝘀:
- Revolut remains a secondary account for many users, capping deposits and limiting the fuel for lending growth.
- Scaling rapidly brings heightened fraud risk - combatting authorized push payment scams requires ever-more sophisticated detection and partnerships.
- Evolving into a full-service bank means stricter regulatory demands across jurisdictions, from AML to consumer protection.
- As the business matures, sustaining triple-digit user growth and revenue diversification becomes tougher amid market saturation.
- Introducing cutting-edge products - especially in crypto - must be balanced against volatility, compliance requirements and customer trust.
- Intensifying competition from both fintech challengers and established banks threatens to slow Revolut’s march toward mainstream adoption.
𝗛𝗼𝘄 𝗹𝗶𝗸𝗲𝗹𝘆 𝗱𝗼 𝘆𝗼𝘂 𝘁𝗵𝗶𝗻𝗸 𝗶𝘁 𝗶𝘀 𝘁𝗵𝗮𝘁 𝗥𝗲𝘃𝗼𝗹𝘂𝘁 𝘄𝗶𝗹𝗹 𝗵𝗶𝘁 𝗮 $𝟭𝟱𝟬 𝗯𝗶𝗹𝗹𝗶𝗼𝗻 𝘃𝗮𝗹𝘂𝗮𝘁𝗶𝗼𝗻?
Opinions: Panagiotis Kriaris, Graphic sources: C-Innovation, Panagiotis Kriaris
4) What does it take to win in FinTech?
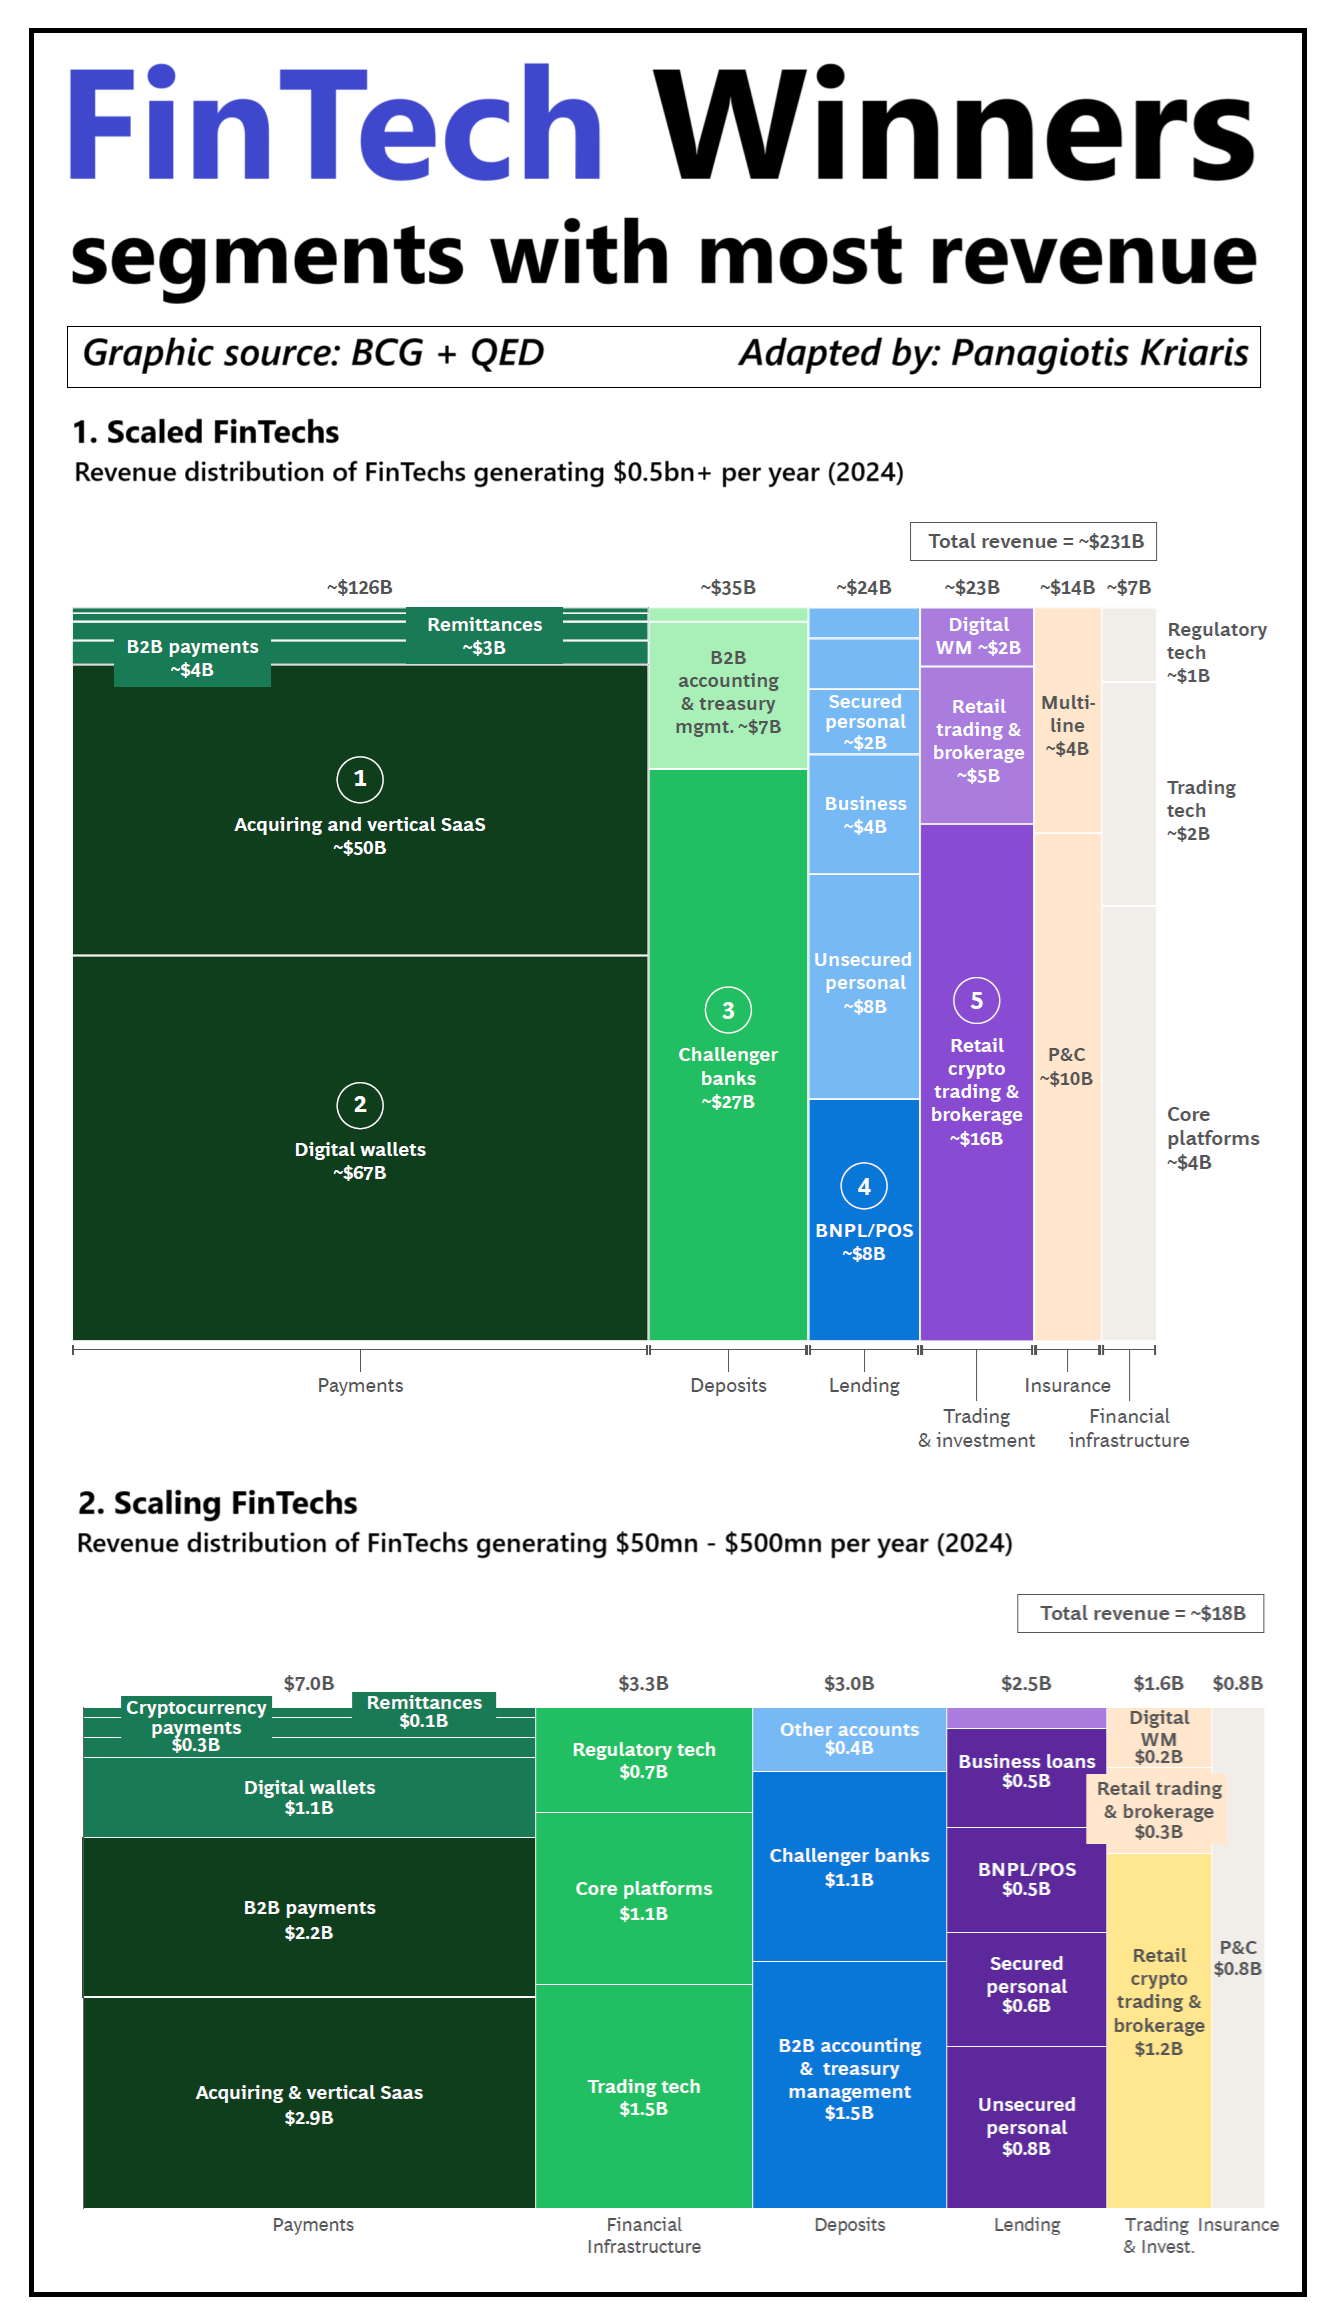
What does it take to win in fintech? These are the segments and verticals driving growth and opportunity.
Fintech revenue grew by 21% in 2024, outpacing traditional financial services by more than 3x. But that growth isn’t evenly spread - success is concentrated in a few players and segments.
Data from BCG and QED Investors reveals that scaled fintechs - $500mn+ in annual revenue - account for 60% of total industry revenue ($231bn out of $378bn), with that scale coming from just 5 (out of 23) verticals:
1. Digital wallets ($67bn)
2. Acquiring and vertical SaaS ($50bn)
3. Challenger banks ($27bn)
4. Retail crypto trading & brokerage ($16bn)
5. BNPL/POS ($8bn)
Notes:
- Payments account for 54% of total revenue.
- Out of ~ 37,000 fintechs globally fewer than 100 have scaled!
- Scaled fintechs have won in verticals where banks have been 1) uncompetitive (e.g. vertical SaaS) 2) unwilling to serve (e.g. lower-income consumers) 3) unwilling to go (e.g. digital wallets, crypto).
- There are many areas where fintechs have struggled. Insurance is less than 1% revenue penetration, lending is just 3% and deposits only 2%. Wealth has less than 1% market share.
- The US accounts for 52% ($120bn) of scaled revenues due its large market and easy access to capital, China for 16% ($38bn) driven by SuperApps and a large market and Europe only for 8% ($19bn) due to its fragmentation.
- Latin America's share is 10% ($22bn) with players like Nubank, Mercado Pago and PagSeguro.
- Middle East and Africa are still very early (less than 1% of total revenues).
However, one figure stands out:
Only 3% of global banking and insurance revenue pools have been penetrated by fintechs ($378bn out of $12.7tr).
The rest 97% is up for grabs.
The question is where does this next wave of scaling fintechs will come from?
BCG and QED define scaling fintechs those with annual revenue between $50mn and $500mn. And these are their fastest-growing segments:
1. Payments are again at the top with 39%: Acquiring & vertical Saas, B2B, Digital wallets.
2. Financial infrastructure with 18% of total revenue: Trading and Regulatory tech, Core platforms. In the last three years, investors have deployed $30bn in this space.
3. Deposits with 17%: B2B accounting & treasury management
4. Lending with 14%: personal, business, BNPL/POS.
FinTech has come of age. But it’s still a tiny fraction of the total opportunity. Next to the verticals there are two major horizontal forces driving the next wave of scale-ups: AI and blockchain-driven onchain finance.
Opinions: Panagiotis Kriaris, source: Global Fintech Report 2025, BCG + QED - Link to BCG + QED report: https://shorturl.at/9bnXQ
Excellent newsletter Panagiotis